How A/B Testing Can Reduce Your Cost per Acquisition by 63% or More

I’m trying out a new A/B testing software specifically for Facebook advertising (which shall remain nameless – for now) and so far I’m loving it. Any great digital marketer knows that TESTING TESTING TESTING is so important, but OMG sometimes it is SO DAMN HARD!

It’s takes SO friggin long to set up all of your different ad combinations (which headline goes with what copy and what image?). And once they’ve started running, you’ve got a billion different metrics staring at you and you feel like aaaahhhhhh!! This one has a better click-through rate, but that one has a better cost per click, and then that one over there has a higher relevance score… WHAT DO I DO?!

I fully admit that sometimes I can be my own worst enemy. I’m not always completely confident. In fact, sometimes I start to second guess myself and I’ll start playing around with campaign settings or even pull the plug on an ad set way too soon.

But the great thing about this A/B testing software is that it helps me stay focused on the end game, the most important metric in the long run – my CONVERSIONS and the ad that gets me the lowest Cost per Acquisition.

Campaign Details

Target

  • Locations: Canada, United Kingdom
  • Language: English
  • Placement: Desktop, Mobile, Right Column
  • Age: 18-34
  • Interests: Digital Marketing, Online Advertising, Search Engine Marketing, Entrepreneurship AND
    Behaviour: Small Business Owners or Facebook Payments Users

Budget & Goal

  • $35 / day with a budget cap of $350
  • View Content set as conversion goal via Facebook Pixel
  • Using WP Facebook Plugin for WordPress to establish pixel goals

The Creative

I’m trying out two different headlines, two variations of body copy and three different images. This works out to 12 different combinations in 12 separate ad sets. Here are two samples:

They’re pretty similar headlines, I admit (maybe I should rethink that next time). Can you predict which headline will win??

Day 1: Campaign Launch

My ads launched at 12:01am on the dot and I’m so excited! They’re active, but still in ‘learning’ mode.

After you create a new ad set or make a significant edit to an existing one, Facebook’s system needs to ‘learn’ who to show ads to. This is why it’s really important not to make any hasty changes to your campaign. Facebook recommends letting your ad set generate approximately 50 clicks and/or 8,000 impressions. Sounds like a lot but, for this to be a true test, we need to be working with statistically significant data.

Since I only have 8 days to run this case study (that’s when my free trial expires), I may not be able to wait for 50 clicks. But I AM determined to wait for at least 48 hours to make my first big change.

Day 2: 48 Hours Post Launch

Alright, it’s been 48 hours now and, to be honest, my ads aren’t doing well. I’m only at 5,000 impressions with an average Cost per Acquition of $4.15 across the entire campaign (that’s expensive, considering my conversion is a content view). I think the fact that I’ve split my budget between 12 ad sets has severely limited my reach. That being said, this A/B Testing software has reported that my Headline is the biggest factor in my ad performance AND the A/B Significance Test from Kissmetrics has determined that the variance is statistically significant.
Variation “A” converted 358% better than Variation “B.” We are 100% certain that the changes in Variation “A” will improve your conversion rate. Your A/B test is statistically significant!

NOTE: Statistically Significant means that there is enough data and enough of a variance to determine that the difference is NOT caused by chance or coincidence. In this case, it means we can reasonably say that yes, the headline is causing the difference in performance.

Check it out – Headline A has a Cost per Acquisition of $2.43 while Headline B has a Cost per Acquisition of $8.61!

So, this is it! I’m pausing Headline B, which brings the number of ad sets from 12 down to 6.

Day 3: 74 Hours Post Launch

It has now been 26 hours since I paused Headline B. My Cost per Acquisition is still high and my Click-Through Rate is still shitty however, today the overall campaign CTR is more than DOUBLE what it was yesterday.

The A/B Testing software now tells me that the image is the biggest factor affecting my Cost per Acquisition and yes, my test is significant!

Variation “A” converted 522% better than Variation “B.” We are 100% certain that the changes in Variation “A” will improve your conversion rate. Your A/B test is statistically significant!

Note that the image stats below only refer to ads paired with the current winning headline. Image A has a Cost per Acquisition of $1.70 and Image B is up to $4.32!

Image C is also performing quite poorly in comparison to Image A ($1.70 vs $3.70 CPA) so I have decided to pause both and just keep running with Image A. This brings me down to only two ad sets with varying body copy.

Day 4: Location Insights

While not specifically part of my A/B Split Test variations, I’ve noticed quite a significant difference in the Cost per Acquisition between Canada and United Kingdom.

Canada is converting 117% better across the entire campaign, so I’ve made the decision to go ahead and remove UK from my audience. This cuts my audience in half, but it’s definitely better to work with a smaller, more qualified audience.

Day 4: Ads Disapproved

Damn! I made it through 4 amazing days of experimenting, but my ads have been disapproved; I’m not allowed to advertise anything that “manipulates” the Facebook brand. I’ve updated the headline to remove the word Facebook but, even still, the ads have been completely disapproved.

I’ve submitted an appeal and requested a manual review, so we’ll see how that goes and hopefully I can get my ads back up and running soon!

Day 5: We’re Back!!

My ads are live again this morning, and I was able to play around a bit and keep the same headlines I’ve been working with (because c’mon, altering the headlines would definitely screw up this experiment.) There are still two variations of body copy running and, although one is performing better than the other, the results are not yet statistically significant. I’ll keep them both active and check back in later tonight to see what’s happening.

12 hours later...

I’ve paused the under performing body copy version and I’m left with this ad as the clear winner on all fronts:

Now it’s time to let it run for a few days and see how low I can get my Cost per Acquisition.

Day 8 Conclusion: A/B Testing Reduced My CPA by 63%

WOW!! There was a HUGE difference between my best and weakest ad combinations. Here we can see that the Champion cost on average $2.34 per Content View, whereas the clear loser cost $6.34.

WINNER: $2.37 CPA
Loser: $6.34 CPA

Lessons Learned and What I’ll Do Differently Next Time

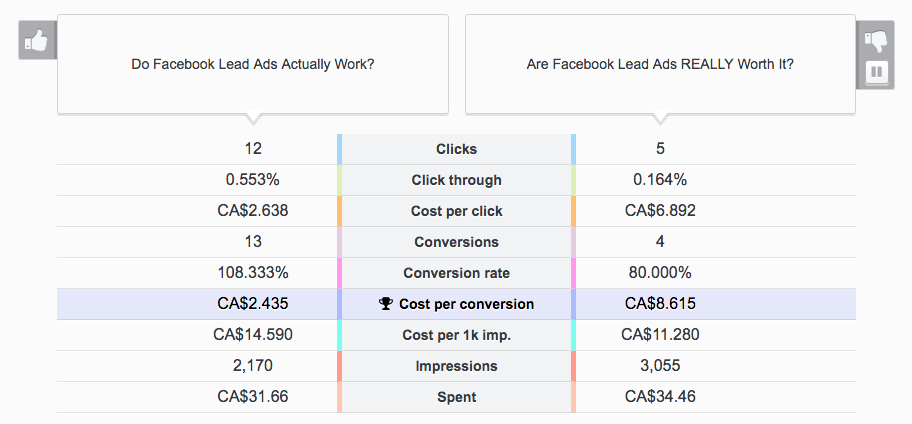
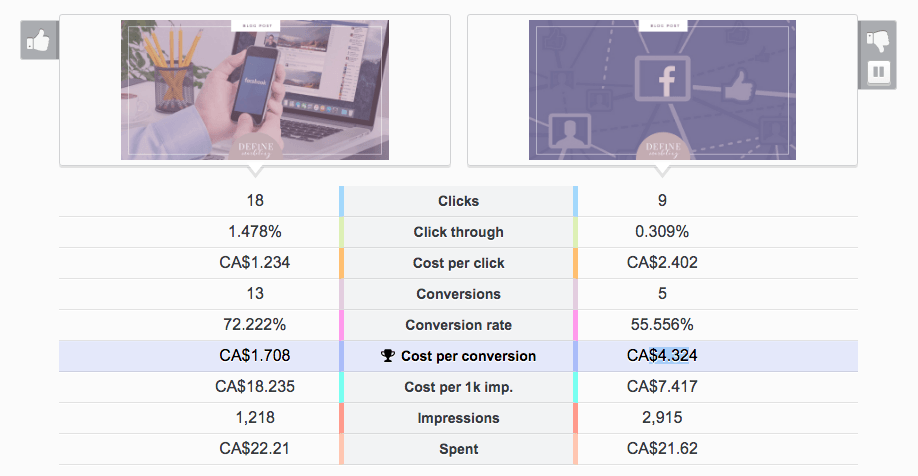
– The more variables you test, the more ad combinations you create, the thinner your budget is spread and the longer it takes to generate statistically signifiant data. Unless I have a ton of time and a ton of money to burn, I think next time I’ll stick to testing out just the headlines and body copy (and then move on to testing images during a second phase).

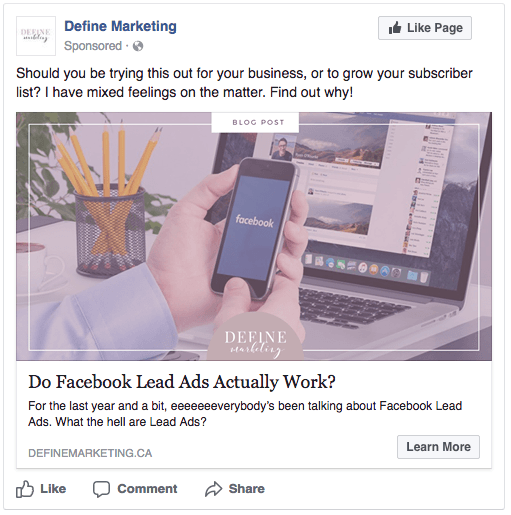
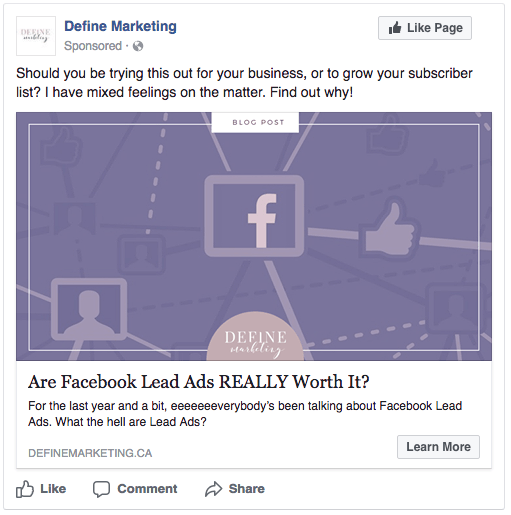
– I think this round of A/B Testing was a bit rushed in my excitement and my two headlines were fairly similar. Next time I think I’ll go for two different angles. Perhaps on one hand I’ll promote a Learning theme and on the other I’ll promote a Save Money theme. I hope this will give me better insight into what my audience (that’s you!) really cares about.

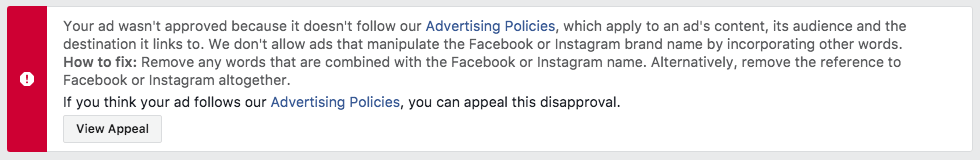
– I learned something about Facebook Ad Policies that I didn’t know before — I can’t use the word Facebook in my headlines! Looks like I’ll need to be cautious and request and manual review anytime I’m challenged.

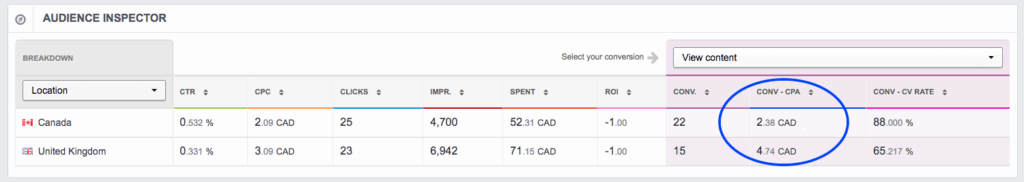
– Next time, I won’t edit my ad sets mid-test. Since the United Kingdom was not part of my A/B Testing and therefore not contained in its own ad set, I had to actually edit ALL of my sets to remove this geographic target. The sets went through a second automated review. Not only did this trigger my ads to be disapproved, it caused a HUGE spike in my Cost per Acquisition in the 24 hours after I got my ads back up and running. I think if I hadn’t done this, my winning ad set would have seen an even lower Cost per Acquisition.

SHARE THIS POST

Related Posts

You can grow your creative local business to 6-figures and beyond.

Let me show you how to get there.

    TERMS & CONDITIONS

    © 2024 Define Marketing by Deirdre Andrews

    It has never been easier to grow a creative local business like yours to 6-figures and beyond.

    Let me show you how to get there with paid ads.